Según indicador de TradingView, Bitcoin continuará aumentando en este ciclo.

Bitcoin (BTC) has now gone through more than 120 days since its fourth halving event in history, and even though the event, which occurs every 4 years, has not yet acted as a catalyst for its price, the market remains bullish based on historical patterns.
As reported by CriptoNoticias, the halving is the event where the issuance of BTC is reduced, ensuring that circulation is limited and scarce. With lower issuance and increasing demand, it is possible for the price to rise.
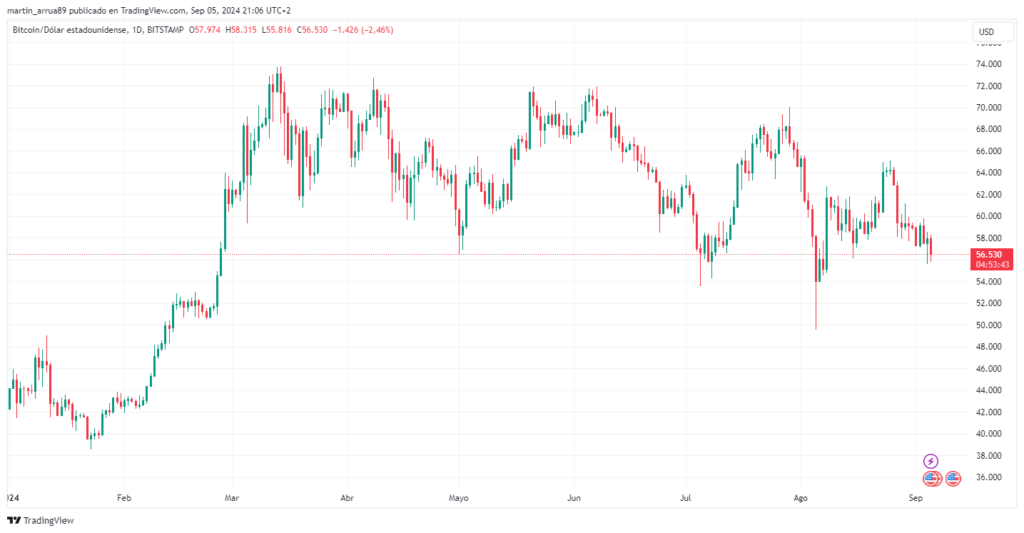
At the time of writing this article, the price of the digital currency created by Satoshi Nakamoto is 20% below the all-time high (ATH) of $73,700 it reached in March 2024, shortly before the halving.
Despite the poor performance in September, there is an indicator that suggests that the digital asset may be entering a bullish cycle based on historical patterns after the halving.
This is the Bitcoin Halving Cycle Profit indicator from the TradingView platform. According to its description on the website, “this indicator streamlines the analysis of halving events, providing explicit signals for profit-taking and dollar-cost averaging strategies.”
In the chart, the start of the reduction event is marked with a square and an orange dashed line, the beginning of the optimal zone for higher profitability is in green, and the end of that period is in red.
The shaded green bars mark the start of periods of higher profitability after halving events, based on historical patterns. As seen in the image, these periods usually begin around 40 weeks.
Therefore, following historical patterns, Bitcoin’s price could enter that period of maximum prices starting in January 2025.
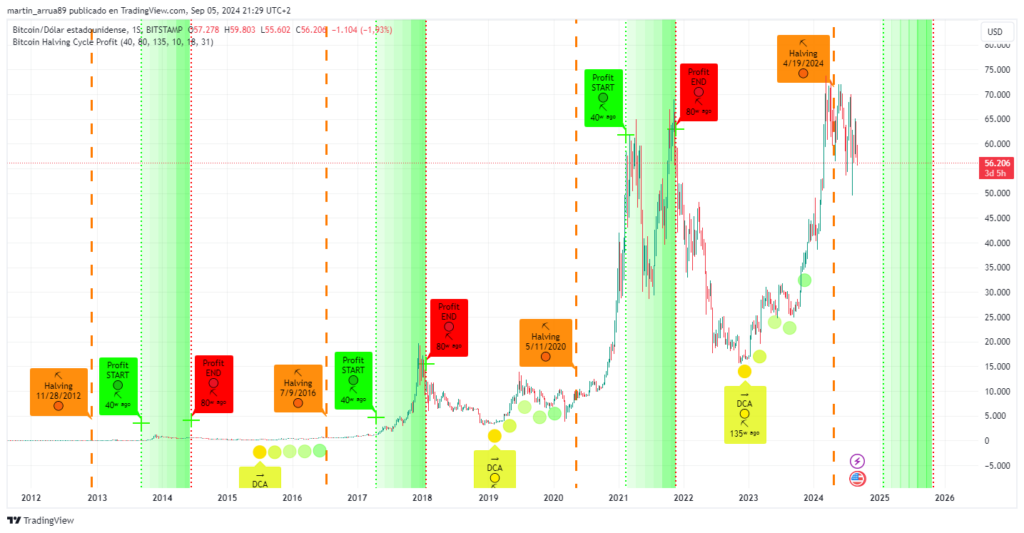
On the other hand, the yellow squares and circles show the points where the Dollar Cost Averaging (DCA) investment strategy should be applied. As shown in the chart, it is ideal to do this 125 weeks after the halving event.
In the educational section of CriptoNoticias (Criptopedia), it is explained that DCA is a form of investing money in financial assets, including BTC and cryptocurrencies. It involves establishing a plan of recurring purchases, with the same amount, over a defined period of time, regardless of the price of each of those purchases. This way, the asset’s volatility is avoided.
What the TradingView indicator does is analyze how the event that occurs every 4 years has affected the price of the digital currency, in addition to indicating the periods of higher profitability based on historical patterns.